t分布
Students T-Distribution
t分布の定義
n個の確率変数 \( x_1, x_2,・・x_n\) がすべて独立で、 \(N(μ,σ^2)\) に従うとき、以下の統計量 t は 自由度 n-1 の t分布に従う・・と定義されています。
\[ t = \frac{\bar{x} -μ}{ \frac{s}{\sqrt{n}}} \]
- \(\bar{x}\) :標本平均
- \(μ\) :母平均
- \(s\) :不偏標準偏差(母集団の推定値) \(s = \sqrt{ \frac{1}{n - 1} \sum_{i = 1}^{n} (x_i - \bar{x})^2} \)
-
\(n\)
:サンプルサイズ(データ数)
t分布の特徴
- t分布は、正規分布と同様に左右対称の形状をしていて、標準正規分布(z分布)と同様に平均値は 0 です。
- 標準正規分布 \(N(0,1)\) はパラメータなしに一意に定まる確率分布ですが、t 分布は母標準偏差が既知であることを前提とせず、自由度(df:Degree of Freedom)をパラメータとして定義されます。自由度は n-1 とされており、これは標本サイズ n に関連しています。
- t の確率分布から、母平均 \(μ\) の確率分布を求めることができるので、これによって \(μ\) の区間推定や、t検定 すなわち、2群の平均値の差の検定などを行うことができます。
- t分布は、標本サイズが小さい場合や、母標準偏差がわからない場合、またはその両方の場合に最も有効です。
- 標本サイズが大きくなると、t分布は正規分布に似てきます。
描画例
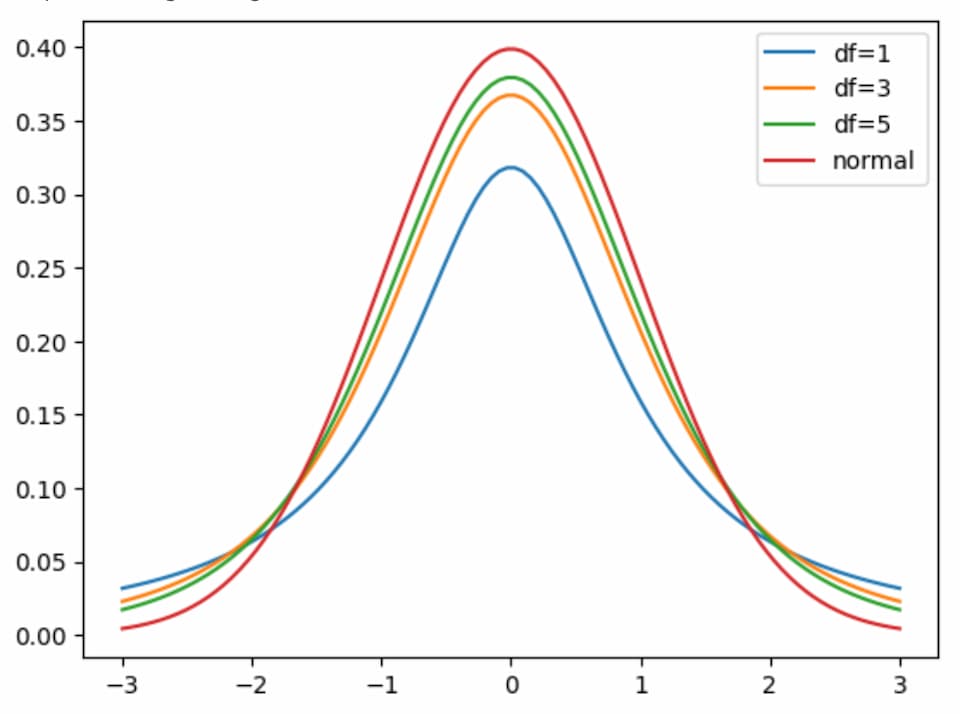
以下、Python の統計関数(SciPy.stats)を使って自由度 1, 3, 5 の t分布と正規分布を描画したものです。自由度が大きくなると、t分布は正規分布に近づくことがわかります。
# ライブラリの読み込み
import numpy as np
import matplotlib.pyplot as plt
from scipy import stats

# データ列の準備(-3 ~ 3 の間で100個)
x = np.linspace(-3, 3, 100)

# t分布関数グラフの描画
for df in range(1, 6, 2):
    t = stats.t.pdf(x, df)
    plt.plot(x, t, label=f"df={df}")

# 正規分布関数グラフの描画
n = stats.norm.pdf(x)
plt.plot(x,n, label=f"normal")

# 凡例を表示
plt.legend()

